Introduction
To meet the need for consistent statewide anadromous distribution data, CalFish cooperators have initiated a series of projects to begin pulling existing distribution data together for select anadromous species. We began developing Coho Distribution in 2002, published the first publicly available version in July 2007 and most recently updated with new information in June 2012. We extended this effort to Steelhead in the Fall of 2004, first published the data in the Fall of 2007 and updated it in Fall 2009 and most recently June 2012. Additionally, we are seeking funding to further extend this effort to Chinook in the very near future.
Coho Distribution and Range ...
Steelhead Distribution ...
Current datasets include:
| Coho Distribution |
Winter Steelhead Distribution |
CA Coastal Chinook Distribution |
| Coho Range |
Summer Steelhead Distribution |
CA Central Valley Spring-run Chinook Distribution |
| |
Winter Steelhead Range |
|
| |
Summer Steelhead Range |
|
Benefits
The primary benefit of these data layers is to help guide management and planning efforts for the species of concern. Having an easily-accessible, continually updated distribution dataset for each species will greatly enhance activities such as developing and evaluating restoration proposals, developing status maps, etc.
Additionally, these datasets can be used to focus further research and assessment efforts. The distribution dataset could be used, for example, to target specific streams that appear to be under-sampled or as a guide to develop a monitoring program. These data could also be used in conjunction with similar data for other species to accommodate multi-species planning efforts.
We also view these distribution datasets as an excellent means of capturing institutional memory. Since they are based primarily on simple observations made by biologists, it is possible to rapidly collect valuable distribution information during short interviews with biologists or by providing a very simple observation form that biologists could submit as they make field observations. There is also a huge amount of observation data stored in spreadsheets, reports, and other personal files. This methodology yields a rapid means of gleaning institutional memory from a variety of formats.
By making the distribution layers available via CalFish, they can be used in combination with a variety of other datasets such as the abundance datasets, the restoration projects database, and the barriers database to assist biologists and managers to gain a wider perspective regarding species status, monitoring, and management.
We view these datasets as important long-term efforts that will be updated and republished frequently as new observations are made and additional information becomes available. In the years to come, these datasets will be a critical tool for helping biologists and managers determine where each species has been observed for a given time period.
Methodology
The methodology developed is observation-based, which means that any recorded observation of the target species (e.g., an incidental observation, data collected as part of a survey, an observation made in field notes, existing distribution data, etc.) can be used to derive the geographic distribution. Thus, the methodology is not tied to any one data collection method: any observation or survey sample may be used providing it has an acceptable geographical reference (i.e., it can be mapped accurately) and can be verified.
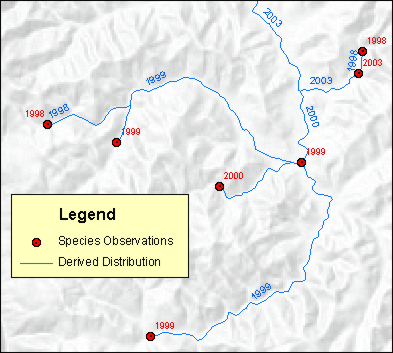
Using this methodology, individual observations are collected and evaluated and then applied to standard hydrography (i.e., stream network) to develop a linear GIS layer portraying the distribution of the target species. The observations are applied to the hydrography by assuming that the target species could have been found anywhere downstream of the point of observation during the year that the observation was made. Each record (i.e., stream segment) in the dataset is coded with attributes including the earliest and most recent year of compiled upstream observations as well as total number of compiled upstream observations. The end result is a GIS layer that portrays all streams or stream parts in which the target species has been observed with the data from the most recent year taking precedence.
![]()
 Illustration of linework development
To further aid local management efforts, the distribution linework is overlayed onto local watershed polygons, specifically Calwater Planning Watersheds, for determination of a distribution "range." With the knowledge that a watershed "drains water, sediment, and dissolved materials to a common outlet"
1, the range layer can be a starting point for understanding the relationship of the anadromous distribution to its surrounding landscape.
One of the advantages of this approach is that it does not require that new field data be collected. Instead, existing data are collected from disparate sources, these datasets are compiled and evaluated, and then stream-level distribution is derived from them. An additional advantage is that it can be continually updated as new observation data become available.
We plan on implementing this methodology to capture range and distribution information for a variety of aquatic animals. We will begin with the anadromous fish species and then work toward capturing similar data for freshwater fishes. Ultimately, this methodology can be utilized to develop distribution datasets to non-fish aquatic species (e.g., invertebrates) as well.
1Federal Interagency Stream Restoration Working Group (FISWRG) 1998